Leaving behind an old image, web apps have become better and better with time. There was a time when web apps performed poorly, and the users were asked to download mobile apps for a better experience.
But now, web apps are improving, and users can browse whatever they like without any hurdles. So, we can say that the comeback has increased the demand for web app development in the market.
Here, in this article, we will introduce you to some of the top web development statistics for the future, considering the previous year’s journey and stats too.
The overall security of web applications has continued to improve but still leaves much to be desired.
This article will introduce you to some of the top web development statistics for 2024 (and beyond), considering the previous year’s journey and stats. By examining these trends, we can gain insights into the current state of web development and anticipate where the industry is headed.
Let’s delve into the numbers and uncover what lies ahead in the dynamic world of web development.
Table of Contents
Notable General Statistics as of recent Days
The online landscape continues to change at an unprecedented pace, influencing how we engage, conduct business and communicate. Here are some noteworthy figures that highlight the scope of internet presence and activity:
- 1.92 billion active websites
- 5.3 billion unique Internet users
- 462 million active social media users
- 8.5 billion Google searches per day
Updated Web Design & Marketing Statistics
It is crucial to have a current understanding of the most recent statistics of web design and marketing. Here are some insightful data to know the current trends and preferences:
- As of January 2024, the estimated number of websites is closer to 2 billion
- The early estimates of global retail eCommerce sales for 2024 are $6.7–$7 trillion
- 42% of consumers leave a website when encountering usability problems or poor functionality
- 46% of the website users prefer the color blue, whereas only 23% prefer the color yellow.
- User Interface (UI) designs that are executed correctly can increase website conversion rates by 200%
- User Experience (UX) design can boost website conversion rates by 400%
- Slow websites can cause a loss of $2.6 billion in sales every year
- The US had 200.64K web developers and designers in 2022, which is estimated to increase to 228.58 by 2032
Let's connect virtually or ask for an estimate of your project.
Web App Development Stats: Key Pointers
Web applications are essential to business operations and consumer interaction. However, with the growing cyber threats, staying informed about the latest web app development security statistics is necessary. The following are the important details for the same:
- Hackers can attack and penetrate 9 out of 10 web applications
- They redirect users to a hacker-controlled resource, steal credentials in phishing attacks, and infect computers with malware
- Web application breaches are among the top three attack patterns, involved in about 43% of all breaches
- On average, 30,000 new websites are attacked every day
Web Development Stats: Vulnerability
There are many difficulties associated with web development. Its vulnerabilities present a serious risk to enterprises worldwide. Let’s examine some figures in web development.
- 83% of the applications have at least one vulnerability, with 20% of the tested apps with at least one severe flaw (Veracode’s report based on 85,000 app tests)
- 83% of the application have at least one vulnerability, with 20% of the tested apps with atleast one severe flaw (Veracode’s report based on 85,000 app testings)
- Half of the internal-facing web app vulnerabilities are considered high-risk
- One out of ten vulnerabilities is considered high-risk
Top Web Development Trends & Stats
The following is the list of recent top web development statistics in 2024. Many of these already exist, but they are expected to be widespread this year and in the future.
1. AI Chatbots
AI chatbots are becoming more sophisticated by leveraging machine learning, natural language processing, and information retrieval techniques. Chatbots will improve operation speed with voice and text chats and the overall customer experience.
According to the CompTIA Industry Outlook 2024:
- 22% of companies are actively pursuing the integration of artificial intelligence (AI) into a wide range of technology products and business activities.
- 33% of businesses are using AI in a limited way.
- 45% of businesses are still in the research stage.
2. Optimized Voice Search
According to DemandSage, 4.2 billion people use voice assistants, and this number is anticipated to reach 8.4 billion by the end of 2024.
3. Improved Native Cybersecurity
In June 2021, hackers scraped the accounts of 700 million LinkedIn users to acquire personal information, such as full names, emails, and phone numbers. With such an alarming number, web developers have adapted ways to protect company and customer data.
Application-based multi-factor authentication, such as Google Authenticator, patch management, and Security Operation Centers (SOC), is being integrated.
Mobile Web Statistics
- There are 5.56 billion people worldwide, 69.5% of the total population. That’s a 3.2% annual increase of 170 million internet users.
- According to Statista, 57% of daily internet time is spent by average internet users on mobile. It highlights even more how web developers must consider mobile users when building their websites.
- As per Statista, the average download speed for mobile internet connections is 42.07 MBPS and the median upload speed on mobile devices is 10.33 MBPS. However, these are still not as fast as the median fixed internet speeds.
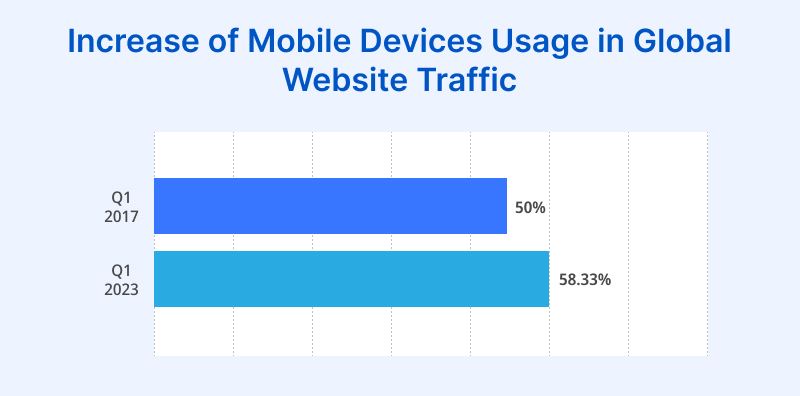
Statista states that 58.33% of all website traffic worldwide in Q1 2023 came from mobile devices whereas, in Q1 2017, mobile’s share surpassed 50% and remained the same for over the next few years.
Web Browser Statistics
Web browsers have a huge influence on how we interact. Let’s delve into the most recent statistics:
As per StatCounter:
- Chrome currently serves over two-thirds (63.55%) of all web traffic (StatCounter).
- With 19.95% of all web traffic, Safari comes in second, ahead of “Other” (0.18%), Microsoft Edge (5.14%), Firefox (2.79%), Opera (2.98%), Samsung Internet (2.38%), and UC Browser (1.01%).
- Even though Internet Explorer used to have a monopoly on the market, Microsoft will be happy to see that Edge had the biggest year-over-year shift (14.9%), mainly because it replaced Firefox.
According to SEMrush:
- Google.com is the most popular website. The site had 95.5 billion visitors in July 2023, more than any other website.
- YouTube and Facebook were in second and third, with 83 and 11.5 billion visits, respectively.
Web developers can also learn a lot from these statistics about how important it is to provide for returning users.
Web Design Stats
According to Crucible, here are the top web design statistics of 2024:
- 65% of the world’s website traffic comes from mobile
- 94% of businesses are influenced by website design
- 42% leave websites due to poor functionality
- 59% of global users prefer well-designed websites
- 73% of companies spend on website designs
- Upto 95% of drop in conversions, if a webpage is cluttered or has too many elements
- 88% of users avoid returning to slow loading websites
- Visitors will stay 88% longer on websites that have videos
Dating Web App Usage Stats
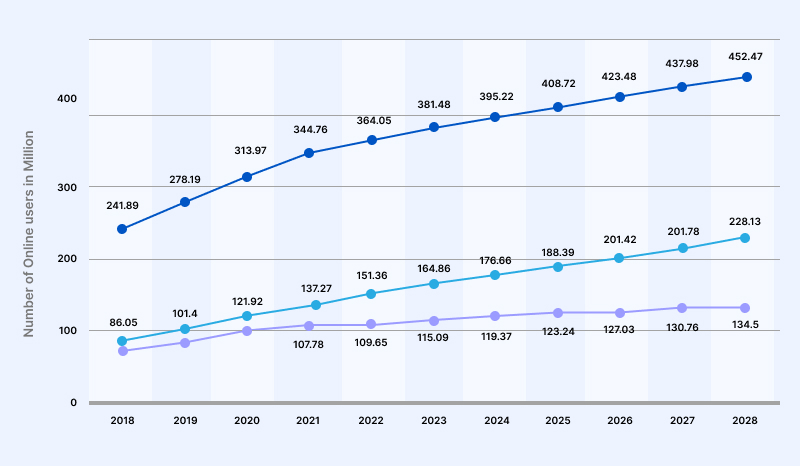
The number of users in all sectors is anticipated to rise dramatically over the next two observations. Here are some related web development industry statistics:
The pattern shown from 2018 to 2028 is sustained for the duration of the projection. Notably, the Online Dating segment has the largest value, with 452.47 million members by 2028.
Let's connect virtually or ask for an estimate of your project.
Leading Dating Apps- Web Development Stats
According to Statista, Tinder was the most popular dating app in February 2024. The company made over 58 million dollars in revenue from in-app monthly purchases.
In the most recent month under review, Bumble came in second place with over 29 million US dollars, and Hinge came in third place with almost 18.5 million US dollars.
Read Also: Dating App Development – Stats, Types, Features, Cost & Monetization Strategy
eCommerce Global Stats
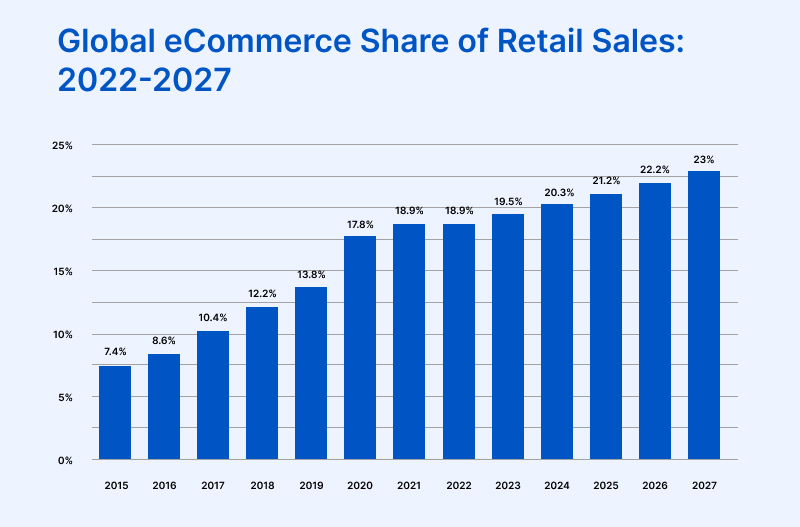
According to Statista, global retail eCommerce sales are estimated to reach $5.8 trillion by 2023. It indicates 39% growth in the coming years, with an expectation of reaching 8 trillion dollars by 2027.
Worldwide eCommerce Growth Stats
Here eCommerce statistics that best represent the state of the sector right now are as follows:
- eCommerce sales may account for 23% of all retail sales worldwide by 2027.
- 2.77 billion individuals are anticipated to purchase online by 2025.
- In 2023, the electronics sector led the market bringing in $837.2 billion in revenue.
- Approximately 60% of all shopping trips begin online.
- 3 out of 4 internet consumers give priority to sustainable brands.
- An unforeseen additional expense is the most common cause of online shopping cart abandonment.
- Digital wallets will account for 54% of all eCommerce payments made worldwide by 2026.
- Temu is the most popular shopping app in the US.
- Facebook provides the greatest social commerce experience.
- The social commerce industry will be worth $8.5 trillion worldwide by 2030.
Reasons Why eShopping and eStores are Getting Popular
Shoppers have turned to online shopping instead of in-person purchases. The primary cause behind the massive growth of the sector is convenience and ease. Let’s explore the causes in detail:
Sustainability
Covid-19 and climate change have changed the priorities of consumers across the globe. They are still shopping but looking for sustainability. Various surveys and reports show that carbon neutrality is vital in boosting sales.
- 73% of shoppers consider the impact on the climate while placing an order
- Stores with a climate-first approach grow 5.8x faster
- Cart conversion grew by 20% for net-zero purchases
Recommendations
- About 70% of online shoppers read one to six customer reviews before making a purchase
- Approximately 61% of online consumers in the U.S. shop after reading recommendations on a blog
User experience
- Free delivery is one of the most influential reasons digital shoppers shop from an eStore
- Easy return policies and offers, and discounts too influenced shoppers to purchase online
- 35% of consumers said they would shop online more if trying a product virtually was an option
- A survey showed that automated welcome emails had a conversion rate of 51.9%
Online Fraud Stats
Despite the best efforts of ecommerce merchants, fraudulent orders continue to rise. It’s estimated that fraudulent orders will account for 1.66% of all ecommerce transactions. This increase is partly due to the growth of online shopping and the fact that fraudsters are becoming more sophisticated in their methods.
- A staggering 47% of fraud involves using stolen credit cards or bank accounts; experts predict this number will grow to 54%
- As per Statista, the eCommerce fraud detection and prevention market is anticipated to expand more than two times, reaching a value of over $100 between 2023 and 2027.
While the increasing prevalence of cyber-attacks might seem discouraging, ecommerce retailers should be heartened by the innovation in security protocols.
Fortanix has developed a new data protection system called Blockchain-based Memory Encryption (BMX). BMX comprises two layers: The first layer encrypts data before it is written to disk, and the second layer decrypts it after it is read from disk.
Let's connect virtually or ask for an estimate of your project.
Read Also: Latest Web Development Technologies
Final Words
As we wrap up the year’s top web development statistics, it is evident that the digital world is still changing in unprecedented ways.
The growing dominance of mobile browsing, the increasing significance of user experience and the irresistible power of quick-loading, search engine-optimized websites.
These web development statistics indicate how user behavior changes due to technology improvements, which help developers and organizations develop more intelligent plans. Embrace these observations to lay the groundwork for reliable, future-proof web platforms.
Considering the good aspects of the web development industry statistics, you can hire web app developers in India to get the best and most authentic services without exceeding your budget.


